


We’re excited to introduce the new Image Map Widget in Arduino Cloud! This powerful feature allows you to overlay live data onto an image, creating interactive and highly visual dashboards. Whether you’re managing a factory floor, an office space, or a piece of industrial equipment, this widget brings your data to life in a whole new way.
In case you’re wondering how to use it, we’ve put together a few examples using some of our existing dashboards to help you understand how this feature can make your data easier to visualize.
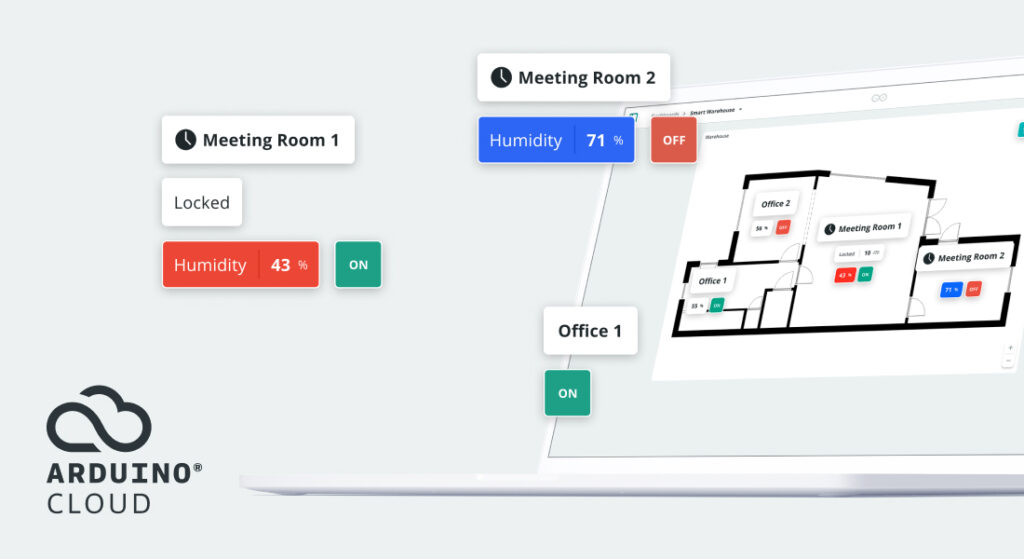
1. Create an interactive office floor plan
Need a better way to monitor different areas of your office, home, or factory? With the Image Map Widget, you can upload a floor plan and place real-time data points directly on it.


Example of an office map with real-time data
At our Arduino offices in Turin, we rely on Arduino Cloud and GIGA Displays to keep our meeting rooms organized and accessible. A few months ago, we shared a blog post about how our engineers developed a custom room booking system that integrates with Google Calendar APIs.
We used a traditional Arduino Cloud dashboard listing all meeting rooms, showing details like seating capacity and availability (see screenshot below).

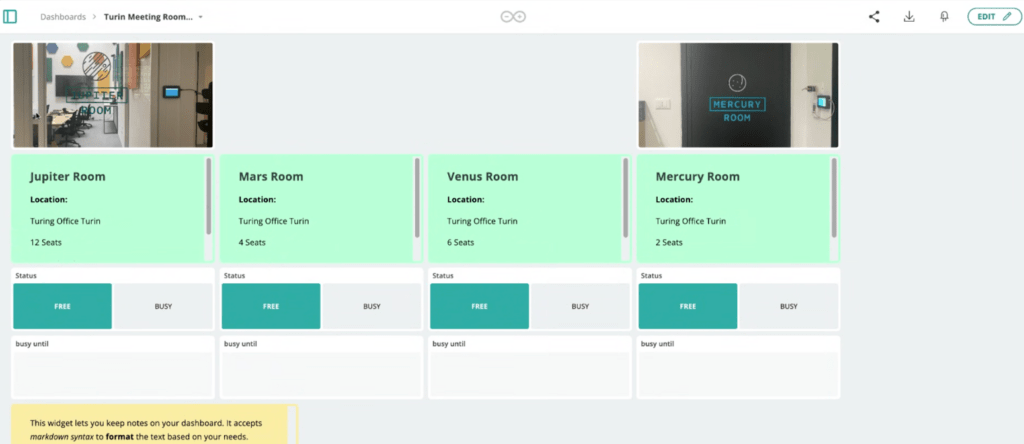
Before: A standard Arduino Cloud dashboard listing all meeting rooms
While functional, it lacked a spatial representation, making it harder to get an immediate overview of the office layout. Now, with the Image Map Widget, our meeting room dashboard has become a fully interactive floor map. Instead of scanning through a list, you can instantly see where each room is located and its real-time availability. Plus, thanks to embedded URLs, you can book a room directly from the dashboard!

After: A smarter meeting room dashboard: real-time availability at a glance
2. Generate a digital twin for machinery
Monitoring industrial equipment has never been easier. Instead of manually checking machine status on-site, the Image Map Widget lets you create a digital twin, an interactive visual representation of your machine with real-time data overlays.
Example 1: Air Compressor Monitoring

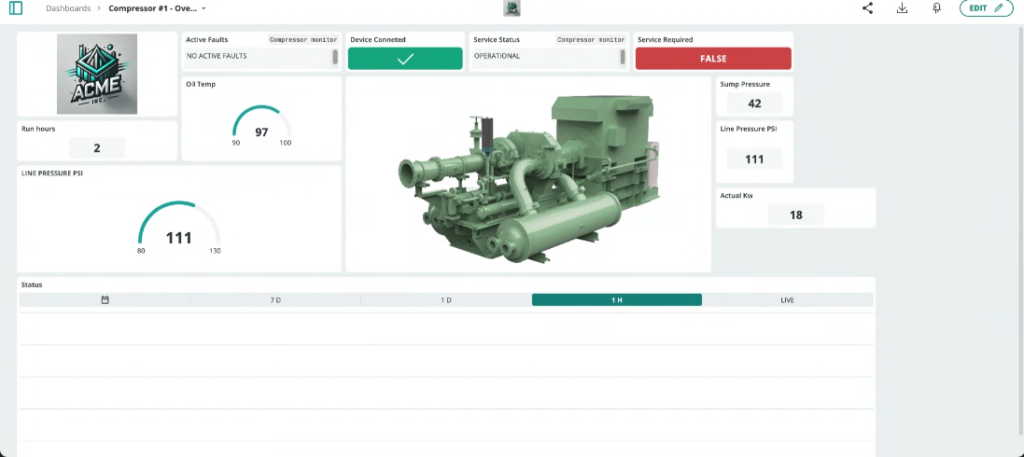
Before: A static dashboard showing pressure levels, run hours, and power usage in separate widgets.


After: A virtual air compressor with markers displaying key data directly on an image of the machine. Now, you can quickly assess its health and performance without being on-site.
Example 2: Industry main control panel
The new Image Map Widget also supports skeuomorphic data visualization, which means you can use real images or schematics of your physical environment — like the layout of your production lines, machinery, or control panels — and overlay them with live sensor data from Arduino-connected devices.


The photo of an industrial control panel with live data markers placed on top providing operators with an intuitive view of what’s happening on the floor.
3. Access status of production lines in an industry plan
Imagine managing a plant with multiple production lines. With the Image Map Widget, you can upload a schematic of the factory layout or simply a clean visual split into 5 vertical columns, each representing a production line (Line 1 to Line 5). For each line, you can display:
- Current phase (Development, testing, optimization, or completion)
- Boolean states (e.g. “Ready,” “Maintenance needed,” “Paused”)
- Throughput metrics


Live status of five industrial production lines
Why you’ll love the new Image Map Widget
- Instant insights – No more scanning lists of data; see everything at a glance.
- Customizable – Add images, pin multiple values, and embed links for deeper insights.
- Exclusive to paid plans – Unlock this premium feature with the Maker plan and any plan for businesses to take your dashboards to the next level.
Ready to transform your dashboards? Try the new Image Map Widget now on app.arduino.cc and make your data more visual, interactive, and actionable!
Let us know how you’re using it — we’d love to feature your project!
The post Introducing the Image Map widget: A smarter way to visualize your data appeared first on Arduino Blog.
Website: LINK

