The unseen universe is all around us – things we cannot see because they are too small for the naked eye to ever register. There is an opportunity to explore the universe in a unique way in VR, and Dynamoid are taking advantage of it with COSM (Available on Viveport – currently US customers only).
We asked Laura Lynn Gonzalez, co-founder at Dynamoid (on Twitter) and all-around developer on COSM, to chat to us about the platform.
What’s COSM about in a (ahem) microcosm?
COSM is a powerful tool for creating VR experiences using all kinds of real data – from scientific data to analytics to financial datasets, and on. The current release on Viveport is a collection of demo experiences we created to show off what the technology is capable of. In the future, we’ll update COSM as a fully-fledged platform where you can create custom experiences.
What can you do in COSM? What’s available to explore?
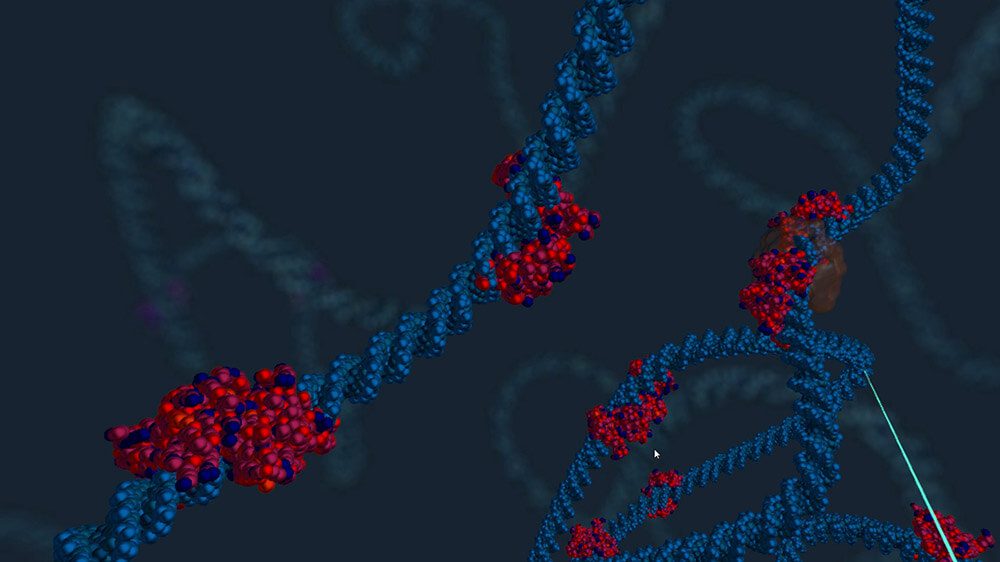
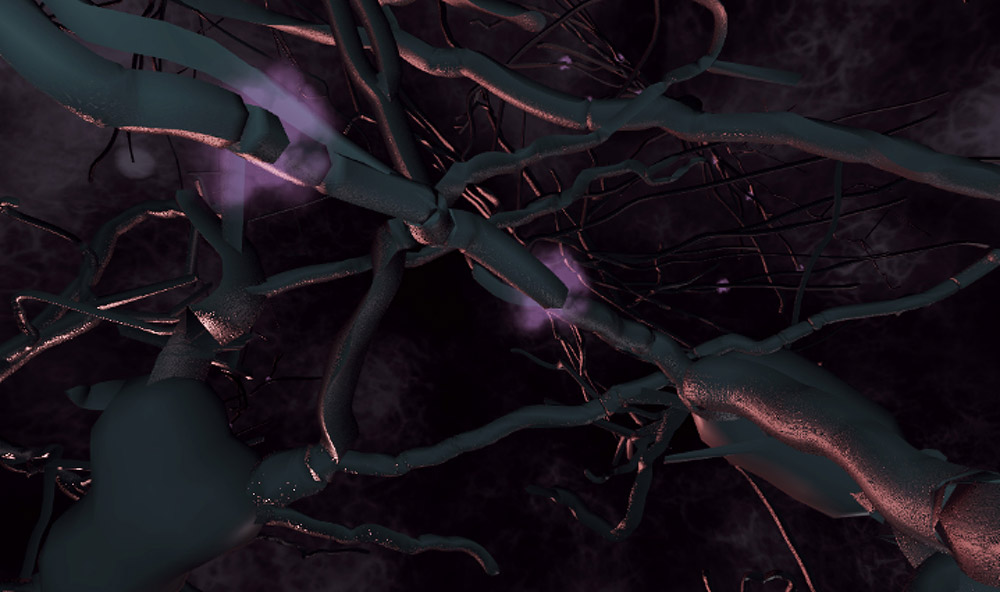
In our original demos, you can zoom into a water plant or a human hand, down to the molecular level, exploring a system of branching, interrelated environments. Recently, we’ve added two additional experiences: one shows off some really cool neuron structures and MRI-type datasets. It includes a mouse environment with a mouse brain, and the inside of a mouse kidney. (Eww right? It’s pretty amazing actually.)
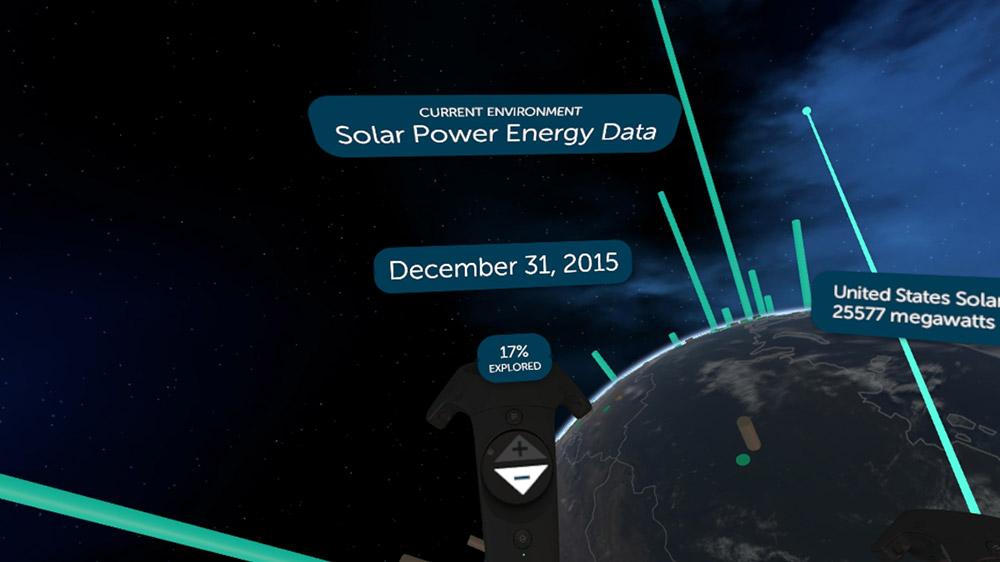
The other new environment gives you a peek into the non-structural data we’ve been implementing: we imported some energy statistics from quandl.com and made an animated visualization of CO2 emissions vs. solar energy consumption/capacity, visualized per-country on top of a model of the Earth (Strangely enough, a similar-looking animation was being passed around the internet this last week or two.) We augmented this solar power visualization with a model of our local star cluster, an “inside the sun” view, and imported a super-detailed model of the ISS that we got from NASA’s website, just for fun. If you look closely, you can see how it appeared in 1998!

What were the origins of COSM? What prompted you to create it?
Back in 2010, I got an NSF grant and made a marginally successful app called Powers of Minus Ten – this was the precursor to COSM in a lot of ways. It had the same zooming navigation, and similar content to some of the current COSM demo environments. The problem with Powers of Minus Ten was that we couldn’t create content fast enough to really satisfy users, so we shifted focus to creating a platform where anyone could use our existing tools to upload data and create their own content. There are a ton of open data repositories – many pieces are there, they just need to be assembled.
Farther back, the inspiration for Powers of Minus Ten came from two places. First, there was a push in the planetarium industry to add in microscopic content to real-time astronomy visualization software, so a lot of the core concepts came from my discussions and collaborations with those guys. The other piece was, of course, the Eames film, Powers of Ten.
What I didn’t envision in the beginning is how suited what we were working on was to the VR medium. I’ve been working in 3D space since forever ago, even making 360-ish immersive films for planetariums, but VR is the first time that the average person can explore amazing 3D content like a pro, without having to learn the complex UIs and control schemes of Maya/Max/Unity/etc or even console games.
What I also didn’t anticipate is how our COSM toolset could be used for any kind of multidimensional data – even data that doesn’t describe something structural in nature. Any time you have more than two dimensions on a graph, it’s very difficult to visualize in traditional, 2D space. Most times you end up with something that looks a lot like a ball of string. Data scientists and content experts can parse these complex graphs, but the average person needs something a little more easy to consume, visually.

If a human is 1:1 scale in VR, just how small do you become in COSM?
That depends, since COSM can support experiences that either expand or contract, a human at 1:1 scale could be a very small part in a large system, or a large part consisting of smaller systems. It’s really up to the creator of that environment. In our water plant and human hand experiences, you can zoom down to the level of macromolecules (where atoms are just starting to be visible), or ~100,000,000x. In our Solar Energy demo, you become about 0.0000001% of your actual size.
What sort of facts are explained while using COSM? What data was used to create it?
The written content of our demo environments is pretty basic, but in general we designed the current experiences to show off the relationship between things at different scales or levels of organization. Over the last six months or so, we’ve been working on supporting a wider variety of data types to demonstrate the huge range of potential uses. So far, we’ve got:
- Protein and molecular structures from the Protein Data Bank
- Neuron 3D structural data from Neuromorpho.org
- Solar energy and other datasets from quandl.com (source of lots of financial and economic data)
- Our local star cluster from the AMNH’s Digital Universe Atlas
- 3D models from NASA
- 3D models from Turbosquid.com
We create a few of the 3D models and animations from scratch, but a lot of the content is imported directly from the sources above.
How do you deal with a potential sense of motion sickness as you ‘zoom’ into objects and change scale dramatically?
We haven’t had any reports of users actually getting motion sickness due to the zoom transition, but we understand that people are concerned that this might be an issue. In the latest release, we added a marquee effect, similar to Google Earth’s, that essentially puts “blinders” on you during the zoom transition. Generally, I think that the radial blur effect combined with the short duration of the zoom is good enough for most people, but we welcome the feedback of the motion-sensitive!
COSM is primarily an education tool. What other possibilities do you think it could open up, when dealing with scale like this?
Although education is an obvious use for the technology, we designed the COSM platform as a general data visualization tool – something that anyone who works with complex data can use to gain insight from their datasets or communicate concepts to others.
At its core, COSM as a micro and macro exploration tool to help people understand complex systems and the relationships of their components at different levels of organization. Our hope is that you’ll be able to use it to explore huge amounts of data in new ways; seamlessly transitioning from one level of complexity to another, pulling up metadata and datasets as you think of them, sharing complex insights with others, etc.

If you could ‘shrink’ in real life – where would you want to see, up close?
That’s a tough question! If you were to actually shrink in real life, aside from immediately dying because the oxygen molecules would be too big for your lungs to use, you would only be able to see things that are larger than about 100 nanometers, or 10,000,000x, because below that level light waves are too big to bounce off stuff that small, let alone come back to your (also now too small) eyeballs. Also, the space between things is either very crowded or very empty, depending on the scale, so you’d likely not see anything perceptible. Part of the reason we’ve been working on COSM is so we can begin to conceive of things that have a physical structure but aren’t able to “see” in a traditional sense.
All of those caveats aside, I’d like to “see” what goes on in the levels below subatomic particles. Scientific models get pretty abstracted away from physical structures at that level, so it’s always interesting to think about visualizing that extreme scale.
Finally – what’s next? Any other VR projects in the pipeline you’d like to tell us about?
COSM development is ongoing – this is just the beginning! In the future, you will be able to import any kind of data, create your own experiences, and remix existing experiences. We’re working on supporting a bunch of different data types and usage scenarios, and are running pilots and gathering user data on how and why people would want to create their own data-based visualizations.
My personal long-term vision is that, together, we’ll be able to build a customizable, modular, visual model of the universe, both in the traditional “structural” sense but that also encompasses the more abstract “universe of data” that is produced through all human activity.
Thanks for talking with us, Laura!
COSM: Worlds Within Worlds is available on Viveport (currently US only).
Website: LINK


